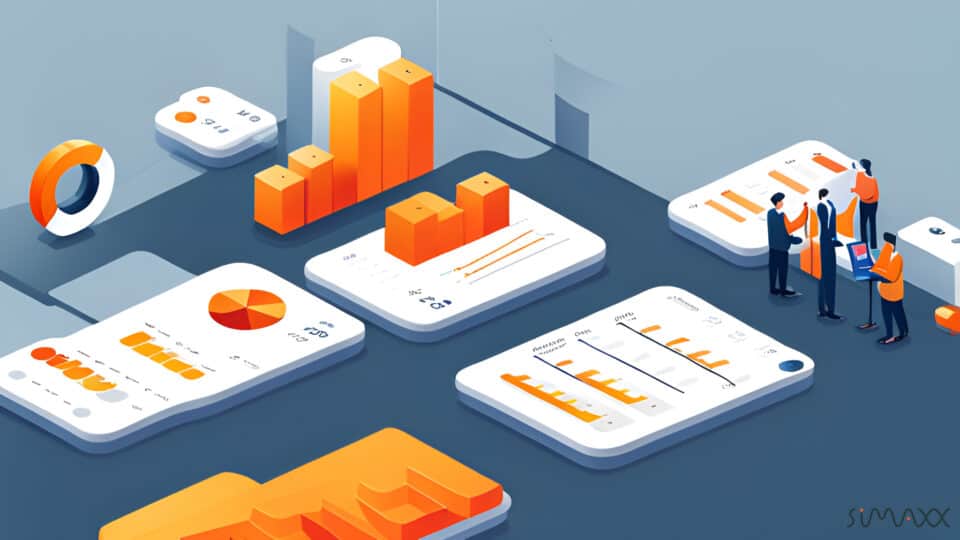
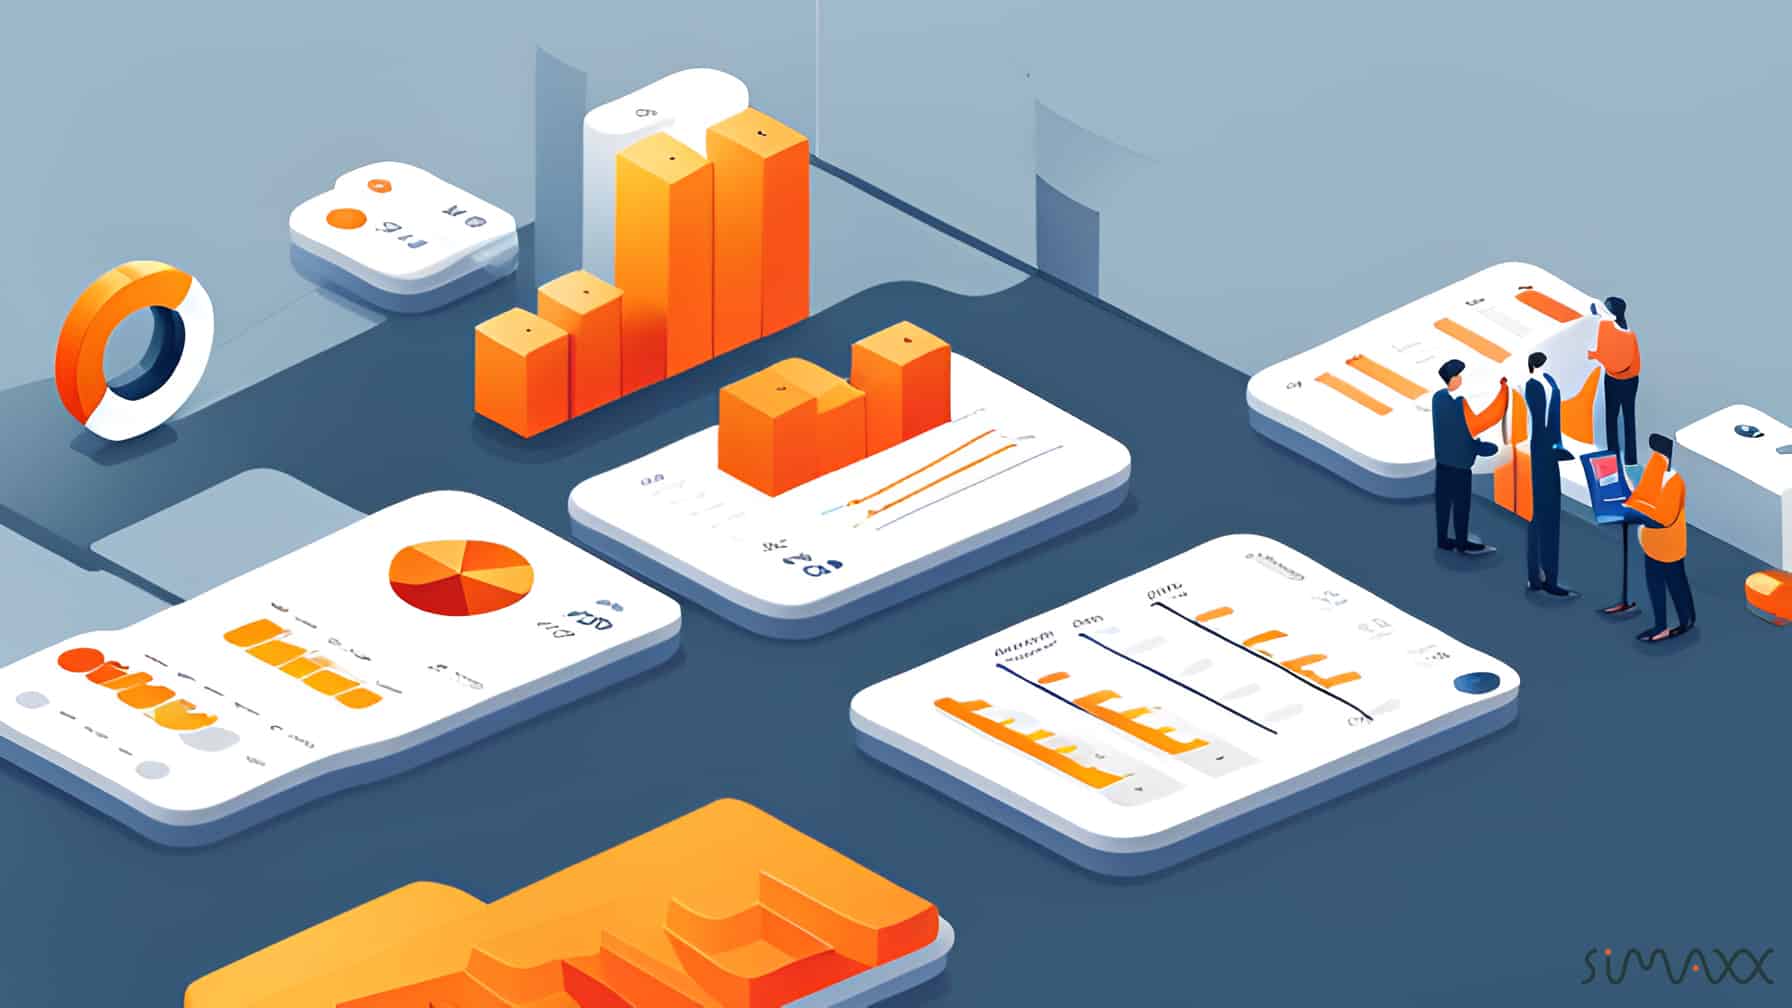
In today’s data-driven world, businesses are accumulating vast amounts of information on a daily basis. From customer demographics and purchasing patterns to operational metrics and financial trends, the sheer volume of data can be overwhelming. However, the true value lies not in the data itself, but in the insights, it can provide to a company. This is where data visualisation steps in, acting as a bridge between raw data and actionable intelligence. In this article we explore why data visualisation is crucial for business and how it empowers decision-makers to drive innovation, enhance performance and gain the competitive edge.
From experience, we have found that people tend to process information in a visual format, much faster and more efficiently than looking at text or numbers. By presenting information from complex data sets graphically through charts, graphs, and interactive dashboards, allows decision-makers to quickly grasp patterns and trends, that may not be apparent looking at raw data enabling them to make informed decisions. For example, by visualizing ESG data, companies can identify areas where they are excelling in sustainability practices and areas that need improvement. The visual representations enable stakeholders to easily grasp the company’s ESG performance, facilitating transparency and accountability.

Data visualisation can simplify complex data by transforming them into concise and easily digestible visual formats, this will allow you to communicate complex information in a straightforward manner, ensuring that there is understanding across the different departments. By providing the data story in a visual format, effective collaboration can be had reducing the risk of misinterpretation.
As previously acknowledged, hidden within the vast amounts of data are valuable patterns, trends and correlations. Data visualisation tools, such as Simaxx Analytics, enable their customers to explore data from multiple dimensions and uncover insights that might otherwise go unnoticed. These insights empower them to make data-driven decisions, optimise processes and identify opportunities to improve efficiencies, afterall to stay on top of key metrics and performance indicators is essential, especially in a fast-paced business environment.
By using interactive dashboards, such as those within Simaxx, we can enable progress to be tracked, bottlenecks identified, businesses to be agile and efficiencies to be made, therefore mitigating risks associated with gut feelings or subjective biases, leading to more informed and objective decision-making and in a competitive business environment, the ability to extract actionable insights from data sets companies apart.
Overview Of Simaxx Analytics And Its Role In Data Visualisation
Simaxx Analytics is a powerful tool that plays a significant role in data visualization. It allows users to explore and understand complex datasets by transforming raw data into more understandable and visually appealing representations. By using Simaxx Analytics, users can create interactive dashboards and charts that provide valuable insights into their data. This tool offers various visualization techniques, such as scatter plots, heat maps, and bar charts, which facilitate the identification of trends, patterns, and outliers in the data.
Additionally, Simaxx Analytics allows users to drill down into specific data points, providing a detailed view of the underlying information. Overall, this tool improves data comprehension and aids decision-making processes by presenting information in a visually engaging and comprehensive manner. Simaxx offers an effective and efficient data visualization tool that can significantly enhance decision-making processes in various fields.
By utilizing advanced algorithms and interactive visualizations, Simaxx Analytics enables users to gain valuable insights and understand complex data patterns quickly. Its intuitive user interface allows for easy navigation and customization, ensuring a smooth and seamless user experience. Furthermore, the tool’s ability to integrate data from multiple sources and provide real-time updates makes it an indispensable tool for data-driven organizations. With its advanced features and user-friendly design, Simaxx Analytics is a valuable asset for businesses and researchers alike, helping them uncover hidden trends and make informed decisions based on accurate and relevant information.
Techniques And Features Of Simaxx Analytics For Data Visualisation
Simaxx Analytics offers a plethora of techniques and features for data visualization that caters to the various needs of its users. One notable technique is the use of interactive charts and graphs, which allows users to easily understand complex datasets and discover insights. Additionally, Simaxx Analytics provides built-in visualization templates for commonly used chart types such as bar charts, line graphs, and scatter plots. These templates can be customized according to individual preferences and requirements.
A. Interactive Dashboards And Widgets
Interactive dashboards and widgets are valuable tools in the realm of data visualization. Simaxx Analytics, for example, provides a user-friendly interface that allows users to create dynamic and intuitive dashboards. These dashboards enable users to visualize and analyze complex data sets in real-time, providing valuable insights into various aspects of their business operations. Furthermore, Simaxx Analytics also offers a wide range of widgets, such as charts, graphs, and maps, which can be customized and embedded into these dashboards. This flexibility allows users to tailor their visualizations to their specific needs and requirements, enhancing their ability to understand and communicate their data effectively.
B. Visual Representation Options (Charts, Graphs, Correlations, etc.)
Simaxx offers various visual representations to aid in understanding complex data sets. Charts and graphs help to present data in a concise and structured manner, allowing the audience to identify patterns and trends easily. Data visualization provides insights through visual representations, uncovering correlations and patterns. These visual representations enhance the overall comprehension and communication of data, ensuring that valuable insights are effectively conveyed to the intended audience.
C. Ability to integrate multiple data sources for comprehensive analysis
Simaxx offers the ability to integrate multiple data sources, enabling a comprehensive analysis of complex datasets. With the ever-increasing amount of data available, being able to collect and assimilate information from diverse sources has become crucial for organizations in various industries. Simaxx allows users to seamlessly combine and interpret data from different systems, databases, and platforms, providing a holistic view of the analyzed data. This integration capability enhances the accuracy and reliability of the analysis, empowering users to make well-informed decisions based on a comprehensive understanding of the data.
Through the use of various visual elements such as graphs, charts, and maps, users are able to quickly identify patterns, trends, and correlations within the data, thereby aiding in the decision-making process. Additionally, data visualization enhances communication and collaboration within an organization by presenting information in a clear and concise manner, facilitating understanding among team members. Simaxx Analytics proves to be a powerful tool in data visualization, empowering users to gain valuable insights and make informed decisions based on the data presented.
D. Operational Efficiency Monitoring
In addition to providing real-time analytics, Simaxx Analytics also offers operational efficiency monitoring capabilities. This feature allows facility managers to assess and optimize energy usage and costs. By collecting and visualizing data related to energy consumption, equipment performance, and occupant behavior, Simaxx Analytics provides valuable insights into areas for improvement.
Facility managers can identify energy-saving opportunities and make data-driven decisions to increase operational efficiency. With this tool, they can track the impact of their energy management strategies and monitor progress towards sustainability goals. Overall, operational efficiency monitoring through Simaxx Analytics enables smart energy management and helps drive long-term cost savings.
E. Artificial Intelligence And Machine Learning Integration
Artificial intelligence (AI) and machine learning (ML) integration holds immense potential in the field of data visualization. With the exponential growth of data, the application of AI and ML algorithms can assist in deciphering intricate patterns and understanding complex relationships within data sets. By employing AI, data visualization platforms can offer intelligent insights and predictive capabilities to users, enhancing their ability to make informed decisions.
ML algorithms can analyze vast amounts of data, identify trends, and automatically generate visual representations, making the process of data visualization more efficient and effective. The integration of AI and ML into data visualization tools has the potential to revolutionize the way data is analyzed and communicated, providing valuable insights and improving overall decision-making processes.
F. Predictive Analytics Capabilities
The Simaxx Analytics platform offers robust predictive analytics capabilities. By analyzing historical data and using advanced algorithms, Simaxx Analytics can predict future trends and outcomes with a high degree of accuracy. This enables businesses and organizations to make informed decisions and take proactive measures to mitigate risks or optimize operations.
The platform’s predictive capabilities are particularly beneficial in industries such as retail, finance, and manufacturing where forecasting demand, identifying patterns, and optimizing resource allocation are critical for success. Simaxx Analytics provides users with reliable and meaningful insights that drive strategic decision-making, improve business outcomes, and promote overall growth and competitiveness.
Conclusion
In conclusion, data visualisation plays a essential role in understanding and making sense of complex data sets. The Simaxx Analytics tool enables users to analyze and visualize large amounts of data efficiently and effectively. The creation of various visual representations such as charts, graphs, and maps helps users to identify patterns, trends, and anomalies within the data. These visualisations provide valuable insights for decision-making processes in various fields including business, healthcare, and research. Overall, data visualization using Simaxx Analytics proves to be an essential tool for extracting meaningful information from data and enhancing data-driven decision-making.
By representing data visually through charts, graphs, and other visual elements, it becomes easier to identify patterns and trends, uncover hidden relationships, and communicate findings effectively. Furthermore, data visualization promotes better decision-making, as it enables data-driven insights, enhances understanding, and facilitates quick information processing.
In the realm of Simaxx Analytics, leveraging data visualization techniques can greatly optimize energy management and unlock significant cost-saving opportunities. Overall, the importance of data visualization cannot be understated as it allows for the efficient analysis and interpretation of data, leading to enhanced understanding and informed decision-making.
The integration of various visualization techniques, such as charts, graphs, and maps, allows users to explore and discover patterns, trends, and relationships within the data. Simaxx Analytics also offers interactive features that enable users to customize and manipulate the visualizations to suit their specific needs, facilitating better communication and decision-making processes. Overall, the significance of Simaxx Analytics lies in its ability to transform raw data into meaningful and actionable insights, ultimately leading to informed and effective decision-making.

