Dashboards & Visualisation
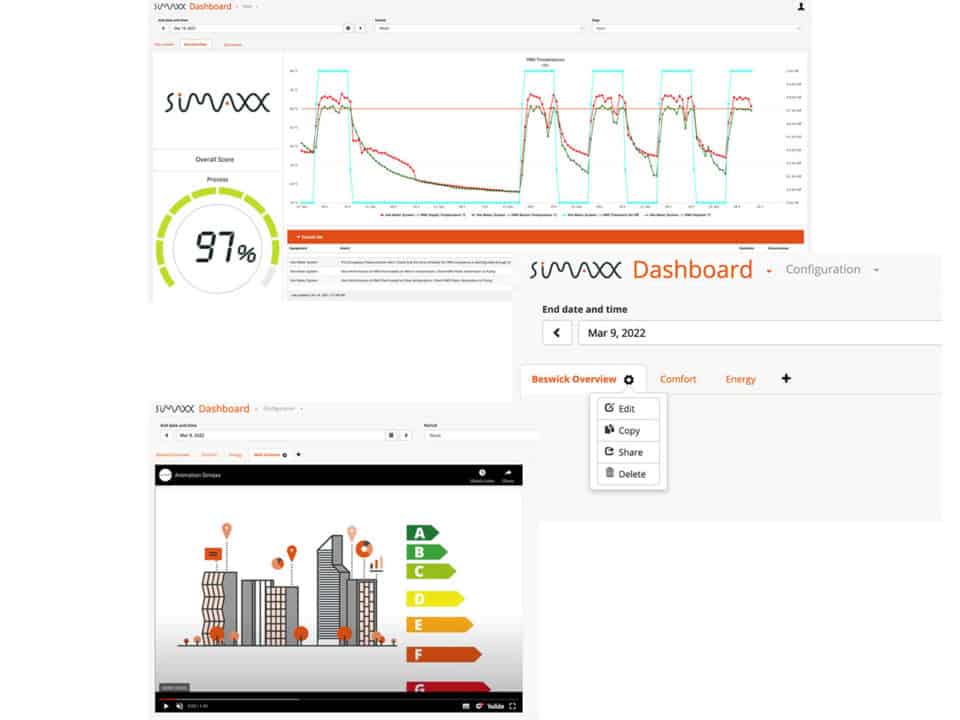
Simaxx presents data and information in a simple dashboard view. Visualisations are created from available structured data focusing on key performance metrics.
Creating Dashboards
Creating and editing dashboards is easy and intuitive using the configuration toolset. Dashboards are arranged in a browser ‘tab’ format, and then ‘widget’ elements are added to a page using ‘What You See Is What You Get’ functionality.
Sharing Content
Simaxx dashboards can be created for personal use or shared with all users of a site. Default views can be created for each site.
Embedded Web Content
Simaxx dashboards can also be configured to contain embedded web content, whether this is a video clip or specific web content.
Case Study: Aquaportal

